Plot valuation (Allverdi)
Allverdi is our tool for valuing plots. You select a property, choose comparable plot sales from the map and get a PDF report with the valuation. The report shows four independent calculations, lets the reader look up each individual sale and places your own assessment alongside the figures. The cover carries the company's logo and name.
Allverdi was developed together with and for Allstad, formerly Opplysningsvesenets fond and one of the country's largest land owners, and was shown for the first time at Oslo Proptech Summit in October 2025. Today the solution is a separate tool that we activate per company. Contact us to get started.
Who Allverdi is for
Land owners and managers with many plots need a valuation they can stand behind. That applies to sales and purchases, and to the redemption and regulation of ground lease plots. It also applies when the portfolio has to be valued in the accounts, and in the ongoing review of what the properties are worth. Public agencies, foundations, funds and property companies are the typical users.
The report is written to be read by someone other than the person who made it: a buyer, a lessee, an auditor or a board. It shows which sales the valuation is built on, how the prices have been made comparable and what the case officer has adjusted, with reasoning. That way the reader can check the valuation themselves.
Allverdi answers something different from Plot Valuation under Analyze in Placepoint Fusion. The analysis shows what plots in an area have sold for per m². Allverdi puts a value on one specific plot and documents it.
The report shows how the valuation is calculated
The reader should be able to check the valuation without asking the person who made the report. The report therefore shows:
- Four calculations. Allverdi calculates the value from registered plot sales, from the plot cost share in comparable new builds, from the plot value in valuation reports and from plots currently for sale. The four figures stand side by side. If they lie close together, the valuation is well supported. If they diverge, the reader sees where and why.
- Every sale included. The report gives the sale date, area, purchase price, index-adjusted price, price per m² and distance to the plot for each sale. The reader can look up all the figures themselves.
- Prices at today's price level. Allverdi converts older sales to today's price level before they are compared, and shows both the registered and the adjusted price. Purchase prices exclude document duty and registration fee, so the figure applies to the plot itself.
- Only clean plot sales. Allverdi checks the sale date against the building case and the completion certificate. If the house was already built when the plot was sold, Allverdi removes the sale from the basis.
- The reasoning behind the judgement. If the case officer adjusts the price because a reference plot is better or worse than the plot being assessed, the adjustment stands as its own figure with written reasoning. The reader sees what is calculated and what is judged.
How Allverdi calculates
All the methods multiply the plot area by a price per m². The methods differ in where the price per m² comes from.
Comparable plot sales
The reference price is the average price per m² for the plot sales you have selected, multiplied by the plot area. The sales are registered transactions from Kartverket over the past ten years, limited to ordinary sales of a single property on the open market.
Each sale is shown with two prices. The registered price is the purchase price as it stands in Grunnboken, so the reader recognises the original sale. The market-adjusted price is the same sum converted to today's level using the house price index for the area, and where no local index exists, using the consumer price index from Statistisk sentralbyrå (SSB). Market-adjusted is the default, because that is the price that can be compared across years.
Plot cost share for new builds
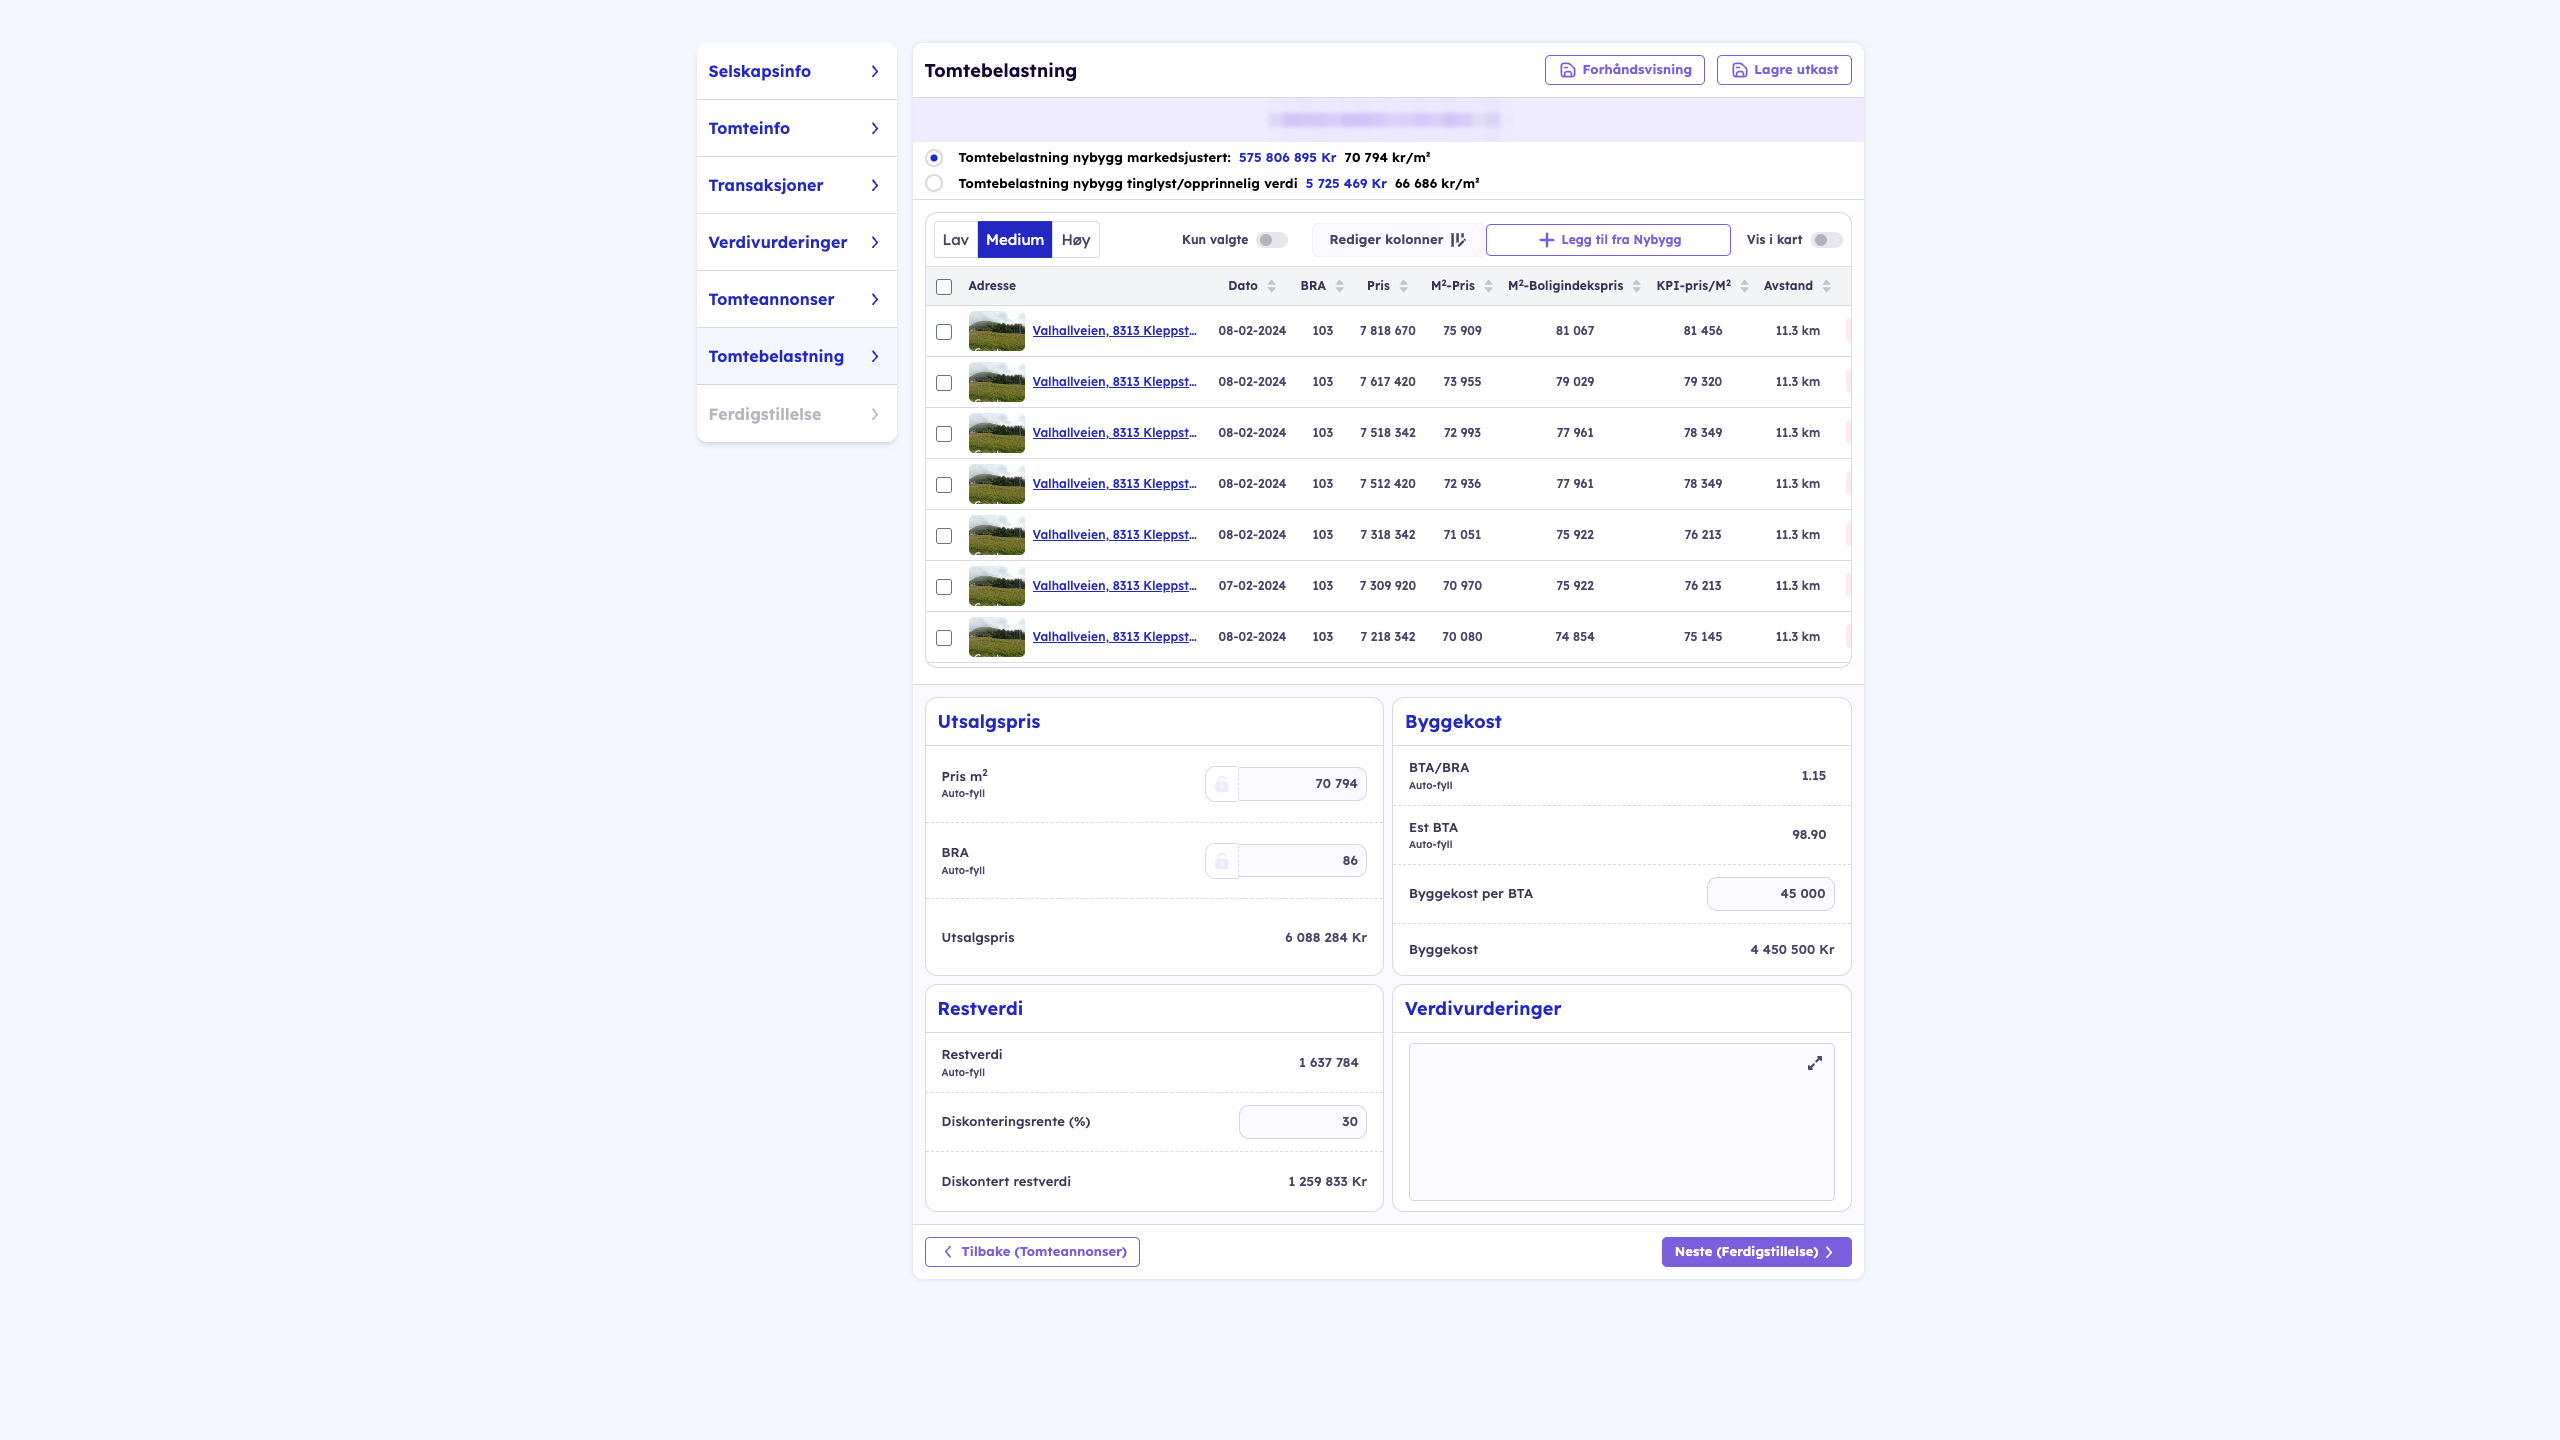
Plot cost share is what a developer can pay for the plot and still make the project add up. Allverdi calculates it residually from comparable new build projects in the area: the expected sales price is the average price per m² multiplied by the average UFA, the construction cost is the estimated GFA multiplied by a construction cost per m² that you can change, and the residual value is the difference. The residual value is discounted using a rate you can also change, with 30% as the default, to account for the time and the risk until the project is sold.
The method is useful precisely where there are few clean plot sales to compare with, such as in built-up areas where plots are rarely sold undeveloped.
Comparable plot valuations
When a property is sold, a valuation report often comes with it, and the surveyor has set a separate value on the plot. Allverdi has extracted this plot value from valuation reports published in connection with property sales across the country. The reference is the average plot value per m² for the valuations you select, multiplied by the plot area.
That is a different source from the sales: a professional judgement of the plot's share of the value, including for plots that have never been sold undeveloped. If the company has its own earlier valuations or sales, we add them as a separate map layer, and they can be included in the same table.
Plot Ads
Plots currently for sale show what sellers expect to get right now. Allverdi calculates the average asking price per m² for the ads you select, excluding costs, multiplied by the plot area. The difference between the asking price and the price achieved also says something about the market.
Adjusted price and final value
The reference plots are rarely exactly like the plot being assessed: one is zoned, another is not, one lies by the sea. The case officer therefore sets an adjusted price per m² with written reasoning, and can in addition record a factor assessment of the plot's characteristics. The final value can be rounded to a whole amount independently of the calculation, and the report clearly shows that this has been done.
How to create a report
Allverdi sits in the Plot Valuation tab on the property. The tab shows the four calculations as cards at the top. Below them there is one table per method: comparable sales, new build projects, valuation assessments and ads. You find saved reports under Verdirapporter at the top of the tab.

-
Select comparable sales. Each table has the filter Low, Medium and High, which controls how strict the criteria for comparability are. Low gives few and very similar sales, High gives more from a larger area. Tick the sales to be included, or click Legg til fra Tomtetransaksjoner to fetch more from the map. Show on map draws the table on the map, and sales you have already included are hidden there until you turn off the filter.
-
Click Lag Rapport. The report generator opens in a new tab with the selected sales. You can click Preview at any time to see the PDF as it stands, or Lagre utkast and continue later.
-
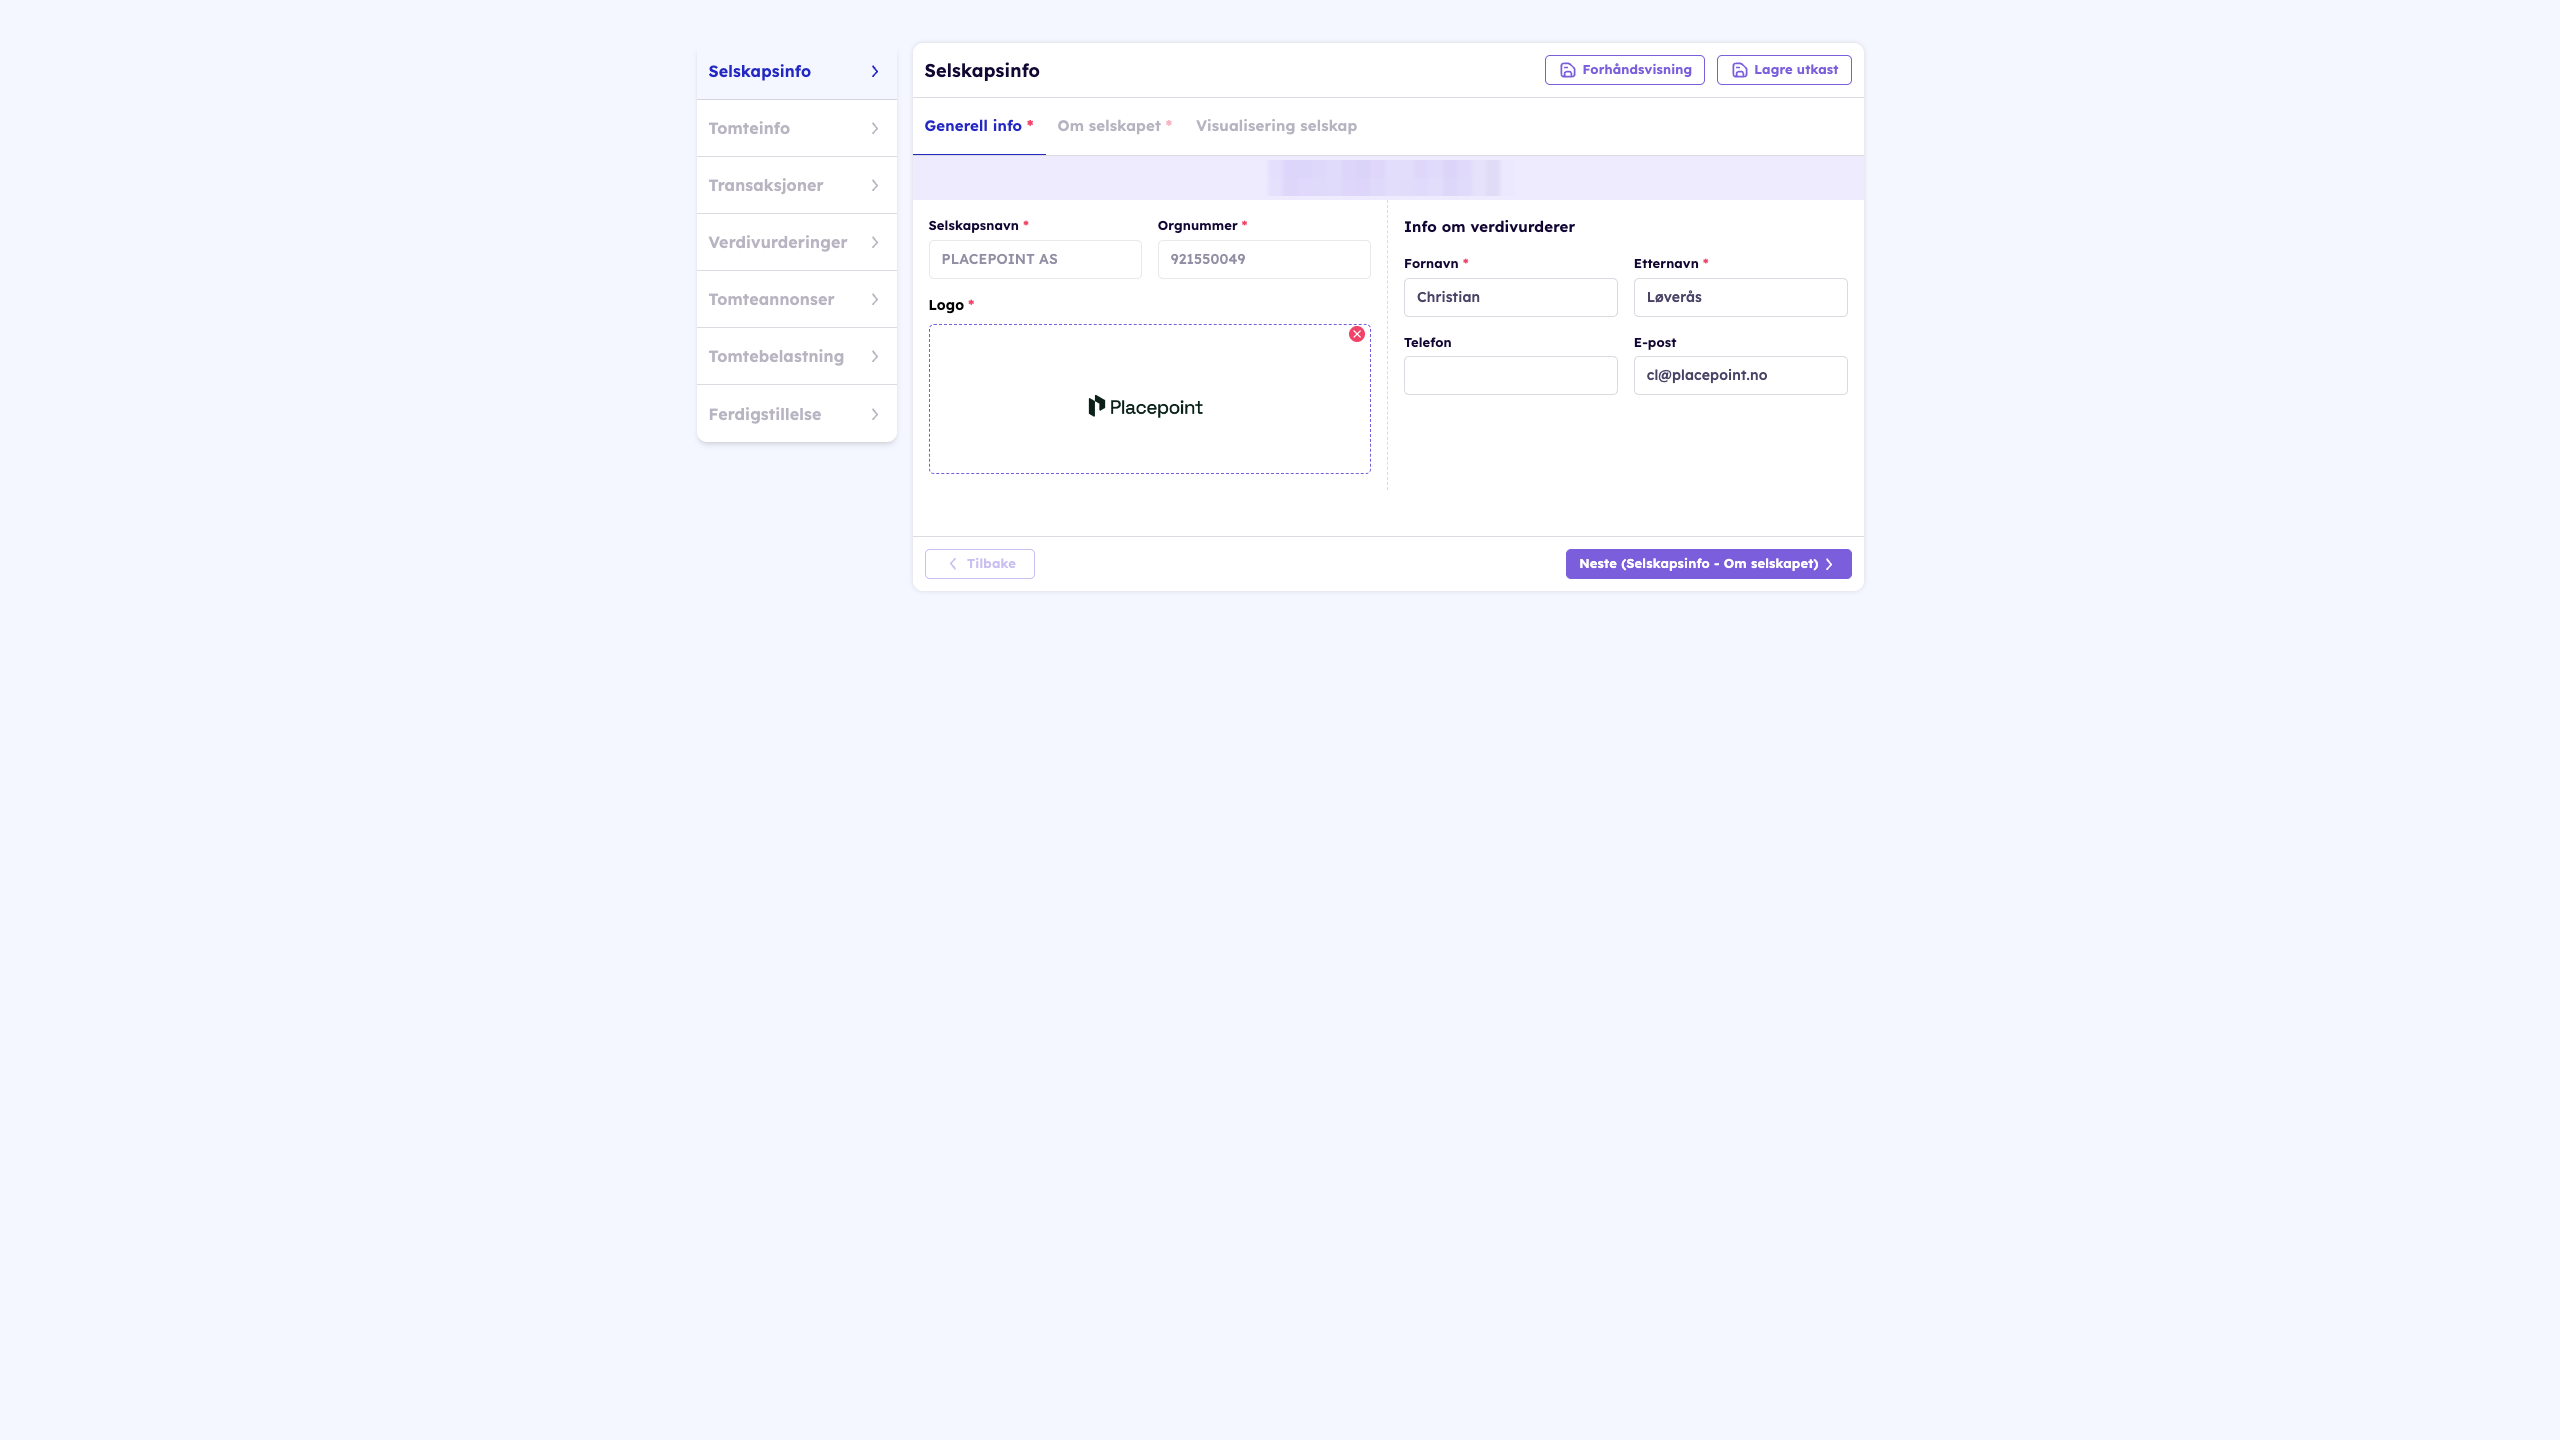
Company info. Company name, organisation number, logo and who assessed the value are filled in from the company setup. You can change the presentation of the company and the image for the property units for this report.
-
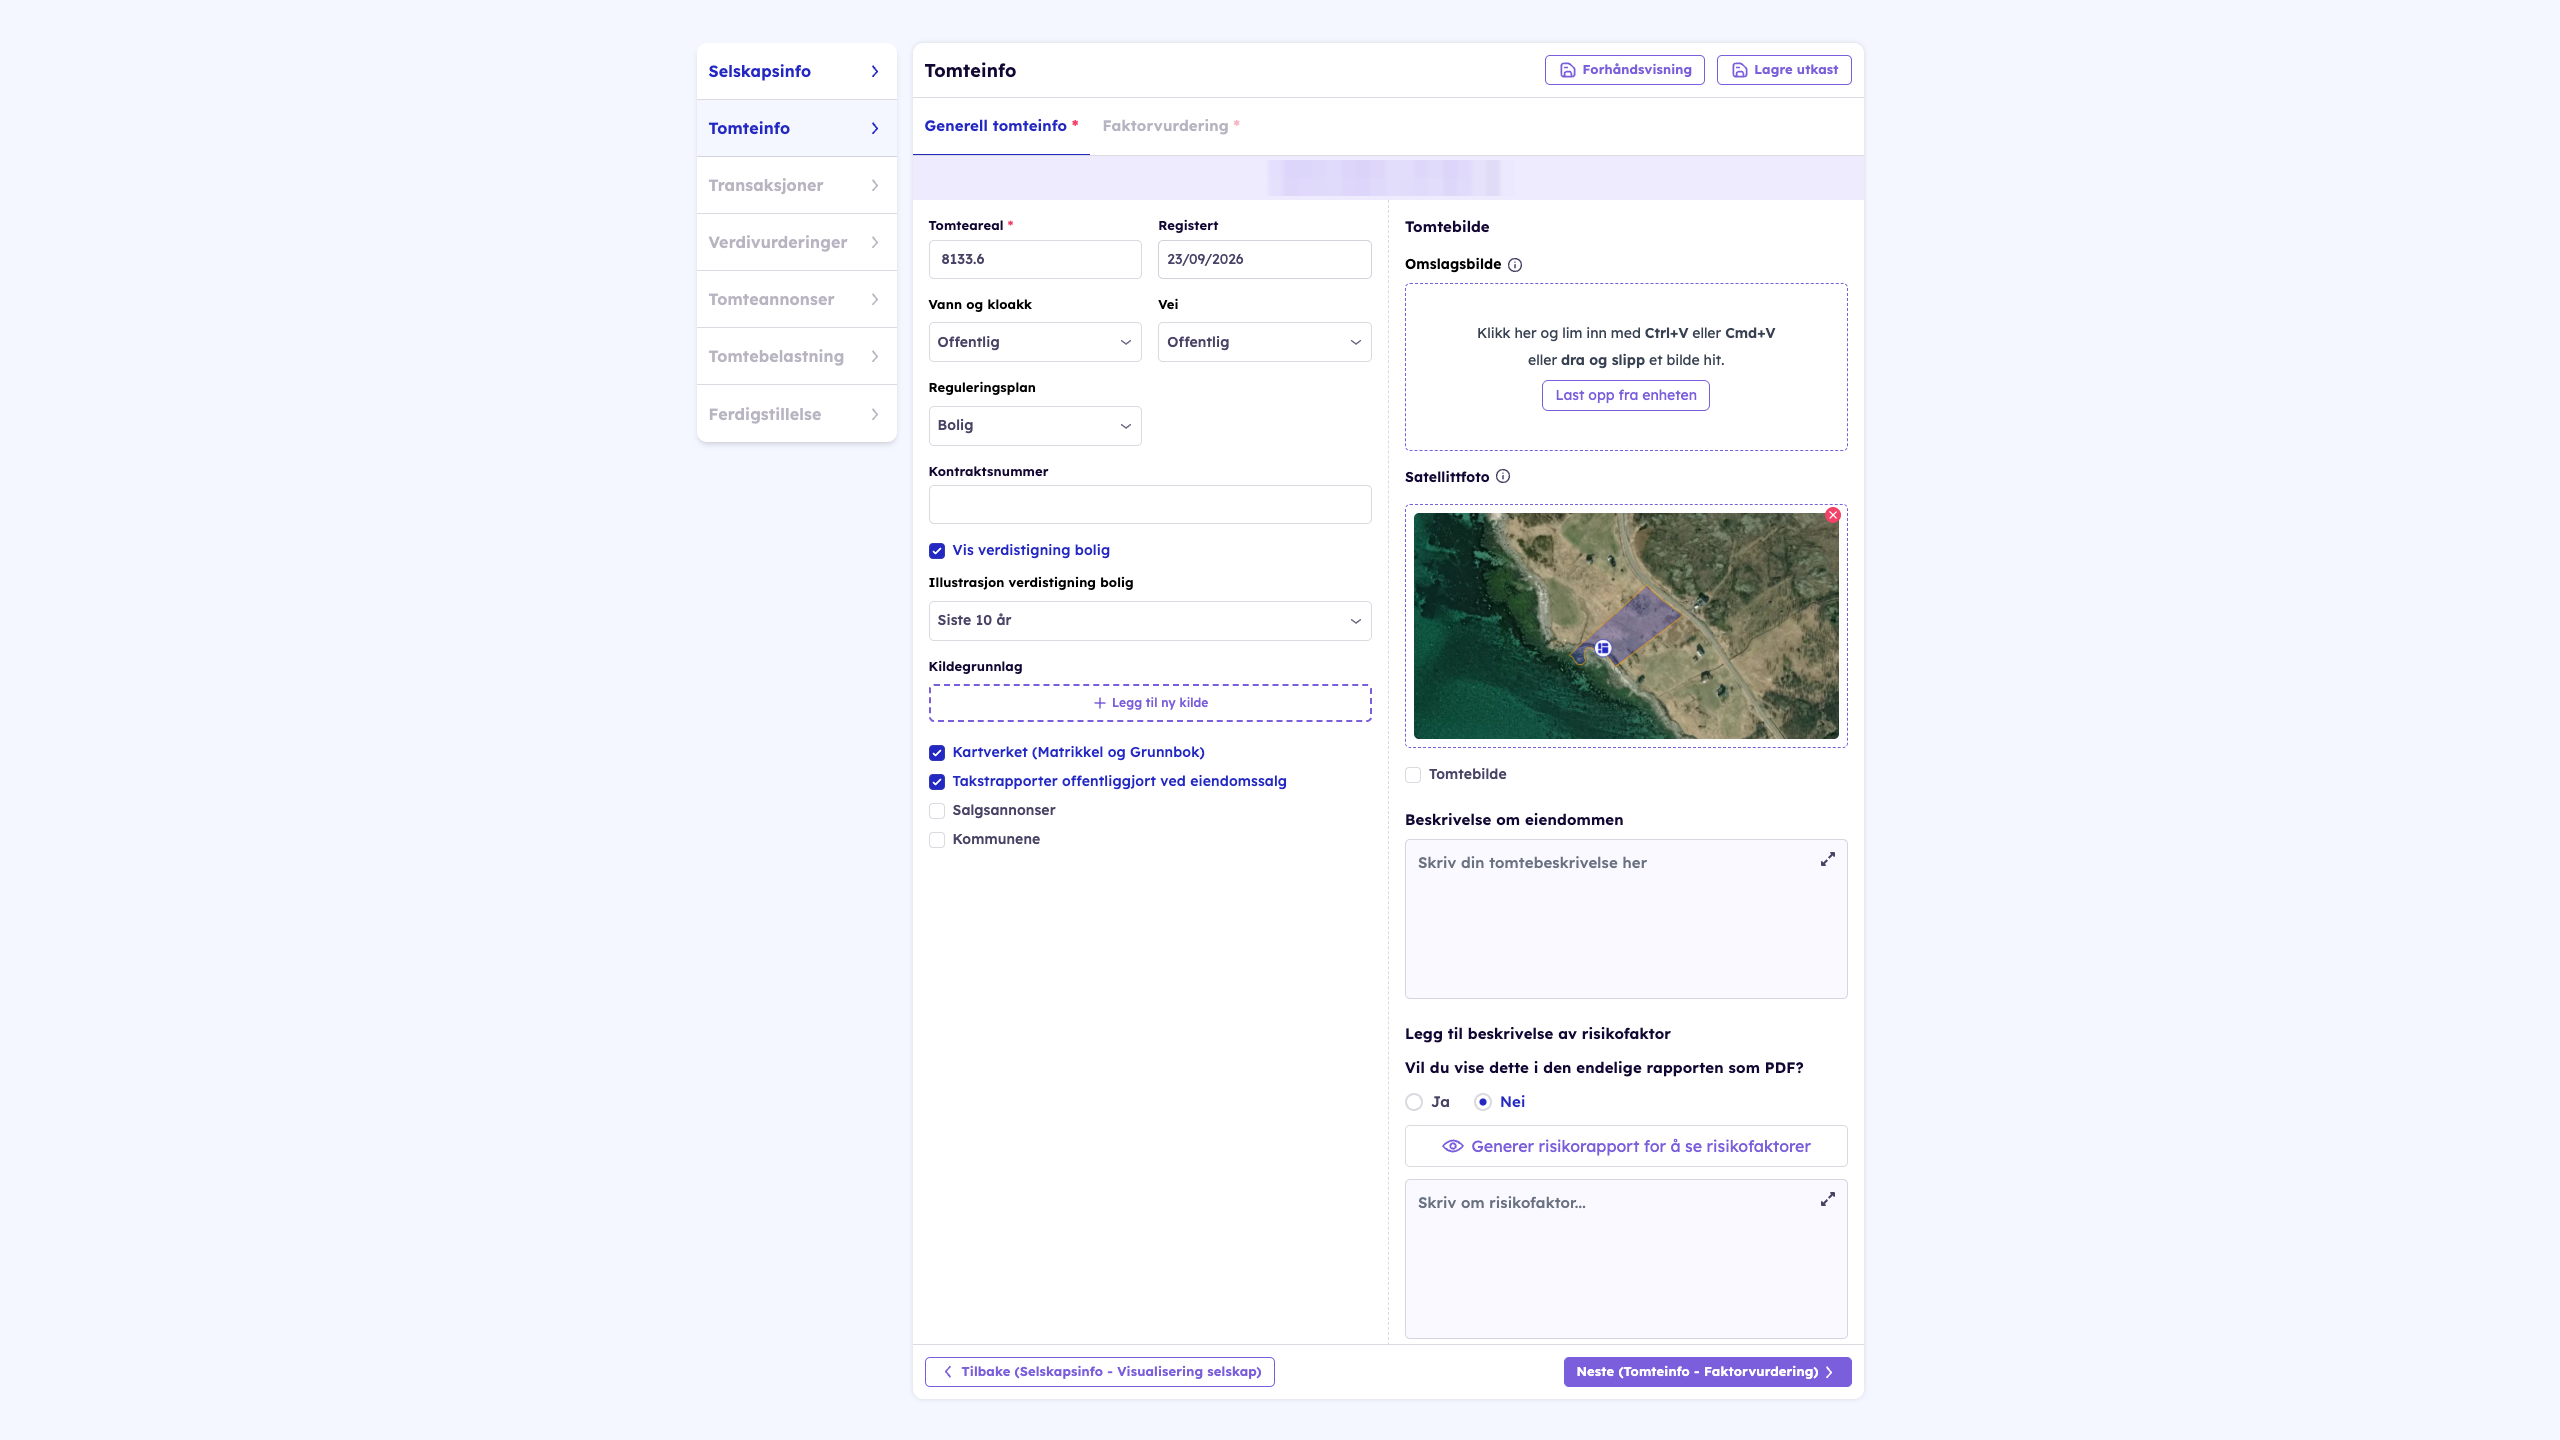
Plot info. Plot area, water and sewerage, road and zoning plan are filled in from the property. Here you write the description of the plot, choose the cover image and satellite photo and tick the source basis the report should state. If you want the risk picture included, you create the risk report here and attach it as an appendix, with natural values and objections that may affect what the plot can be used for.
-
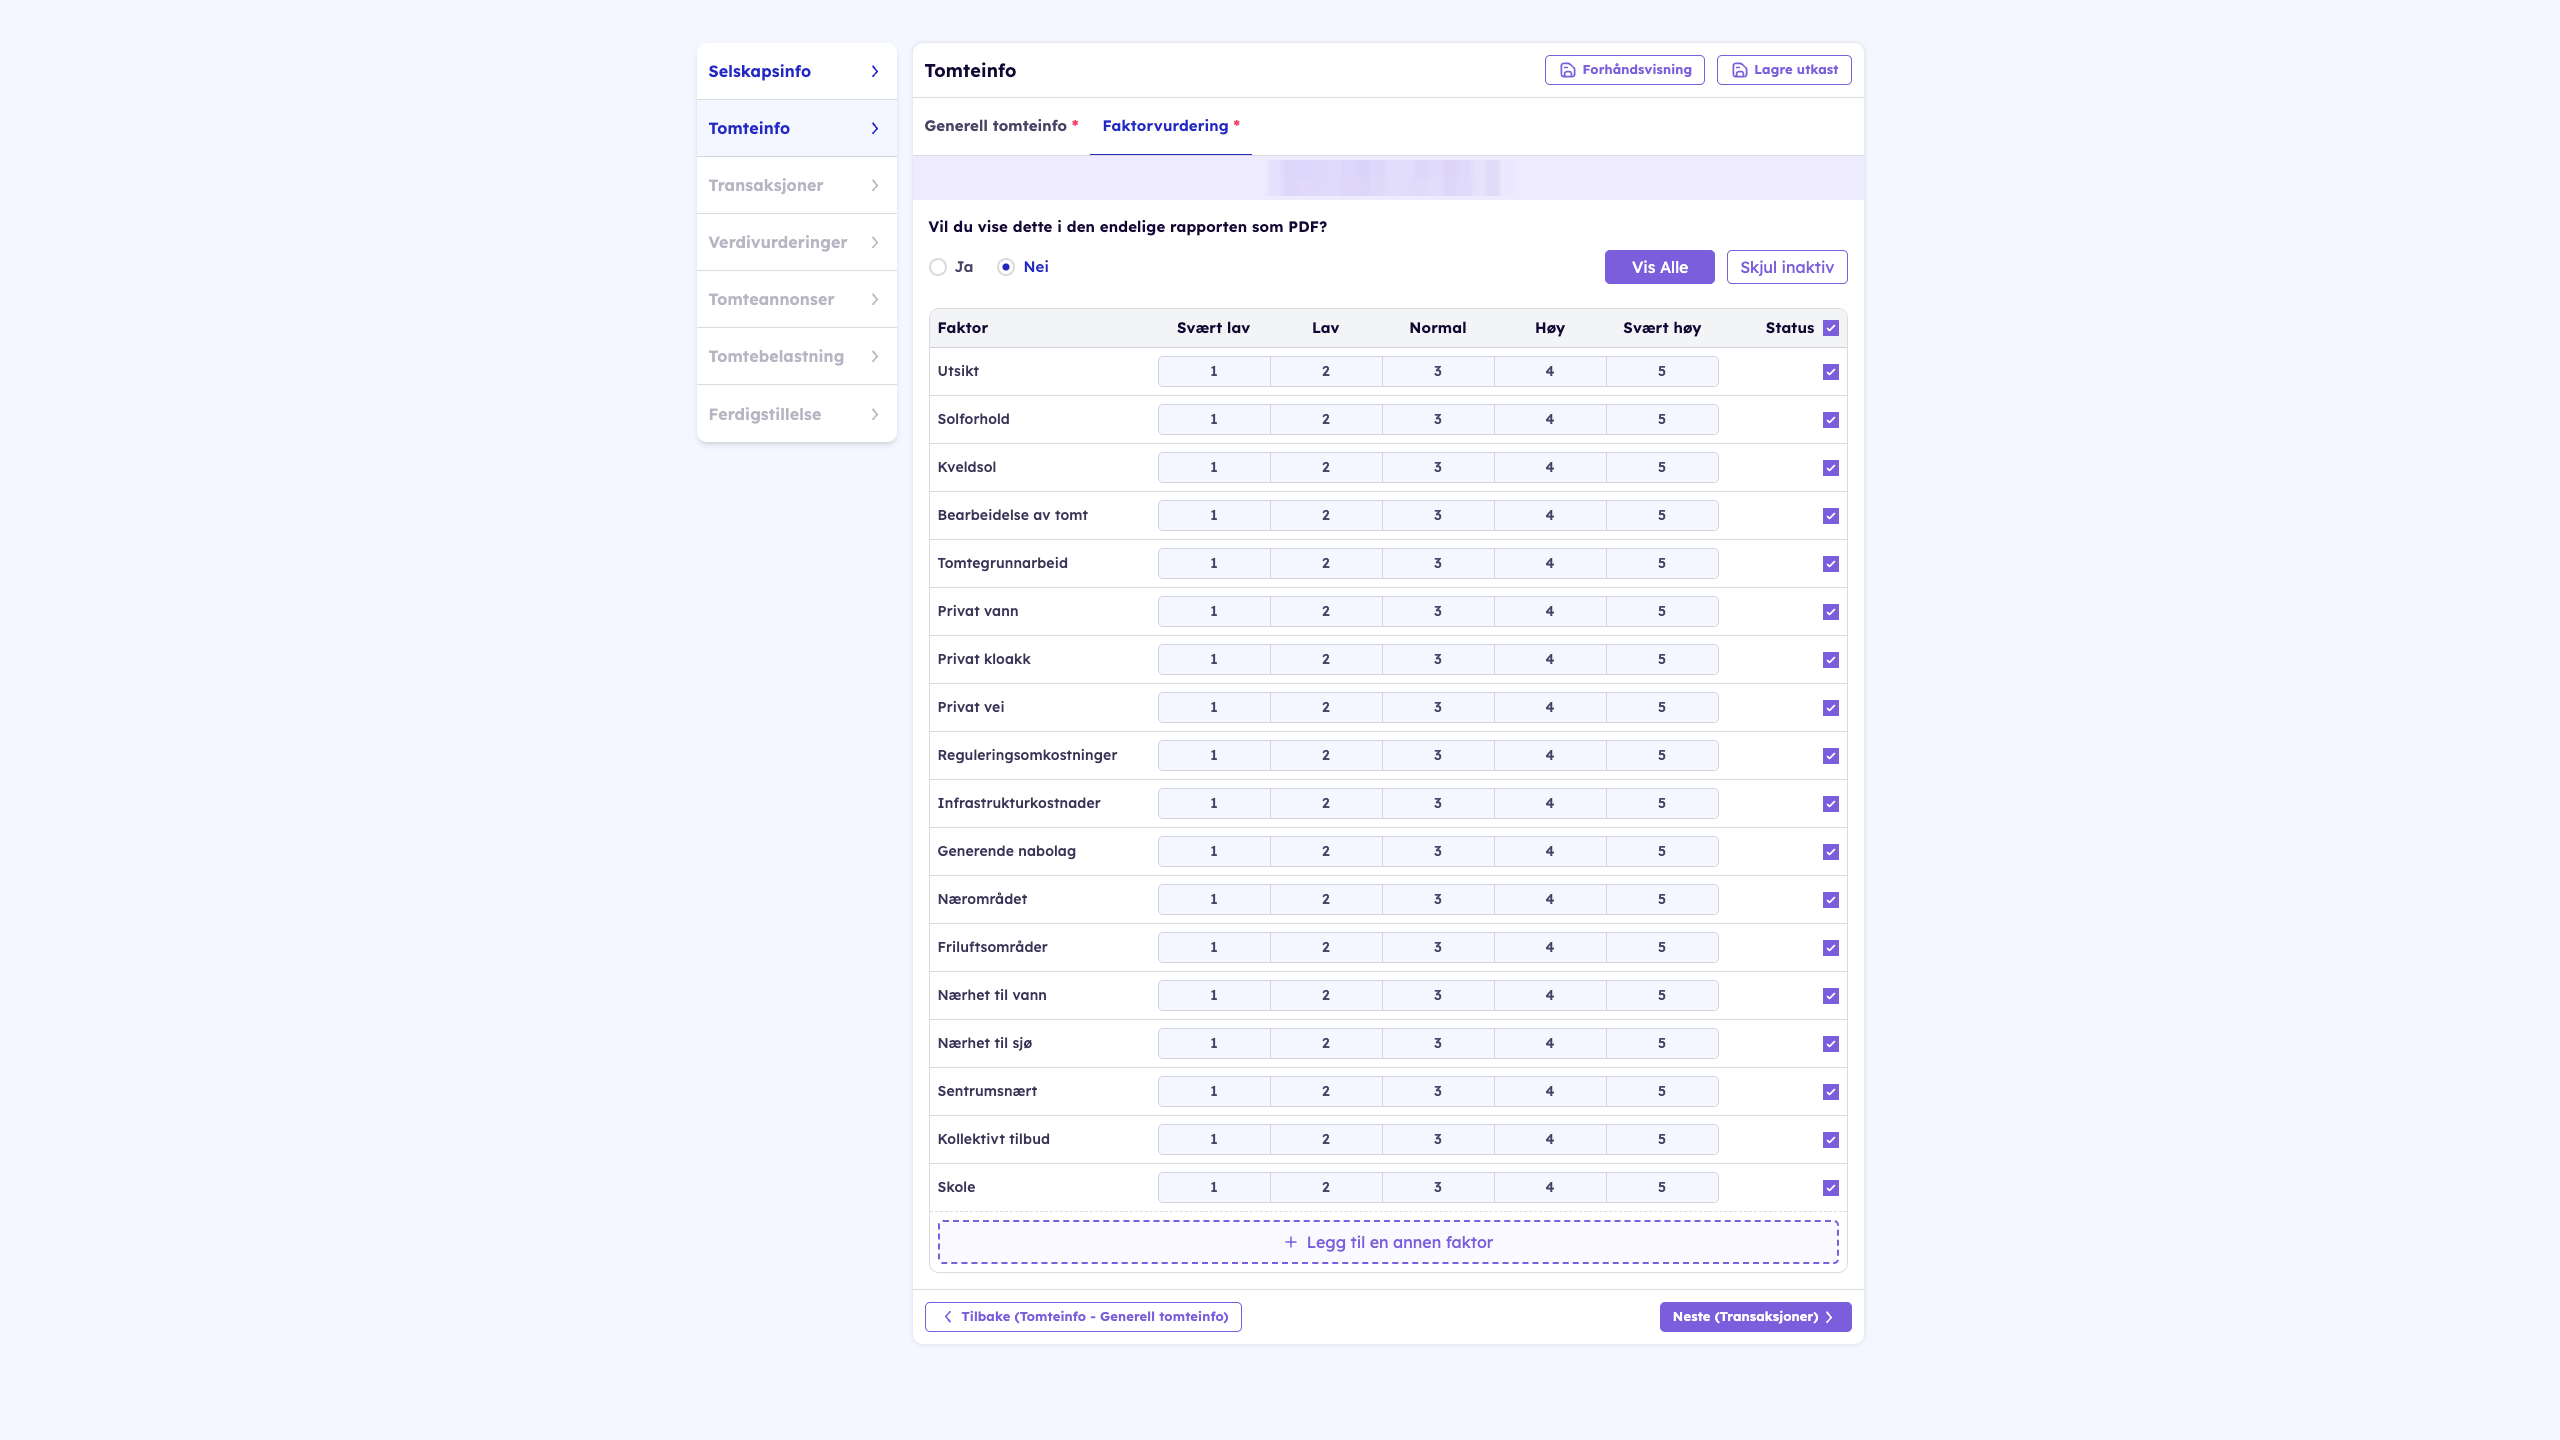
Factor assessment. 18 factors from view and sun conditions to private road, zoning costs and public transport, each on a scale from very low to very high. You can add your own factors and choose whether the assessment goes into the PDF.
-
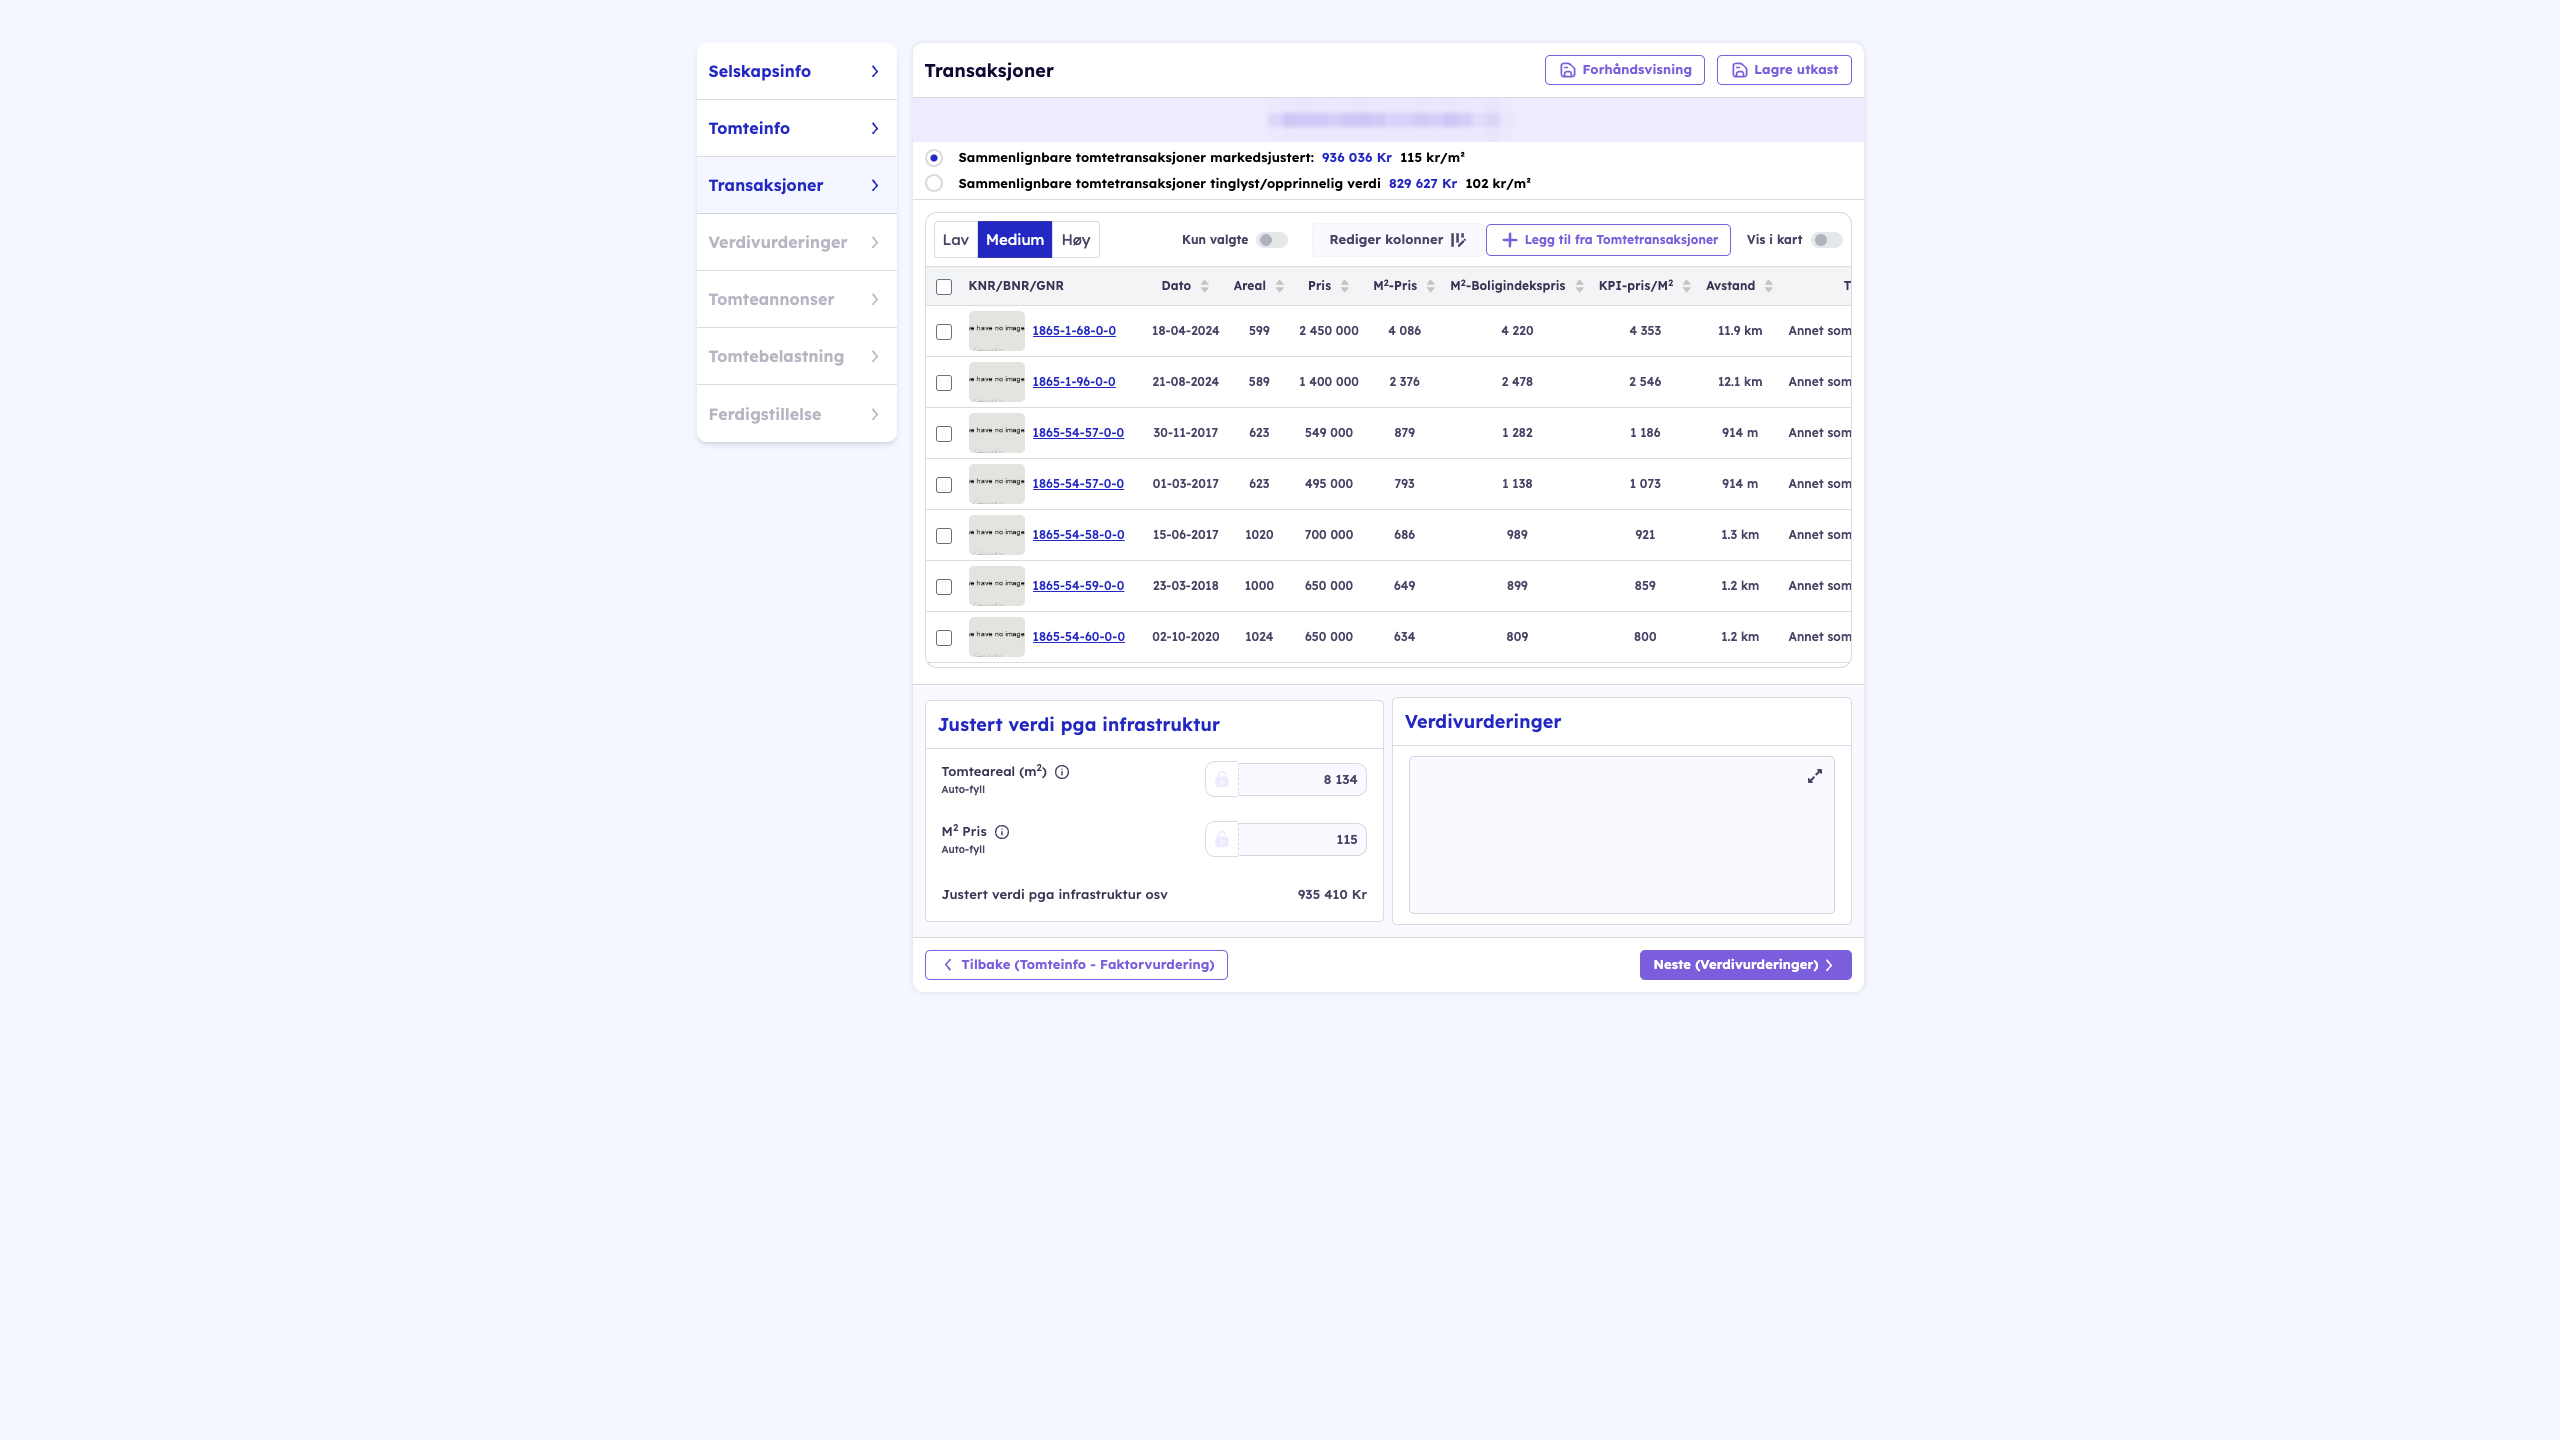
Transactions, valuations, Plot Ads and plot cost share. One step per method, with the comparables you selected. At the top you choose whether the report should use the market-adjusted or the registered price. Below the table you set the adjusted price per m² and write the reasoning. For plot cost share you change the construction cost per m² GFA and the discount rate if the default values do not fit.
-
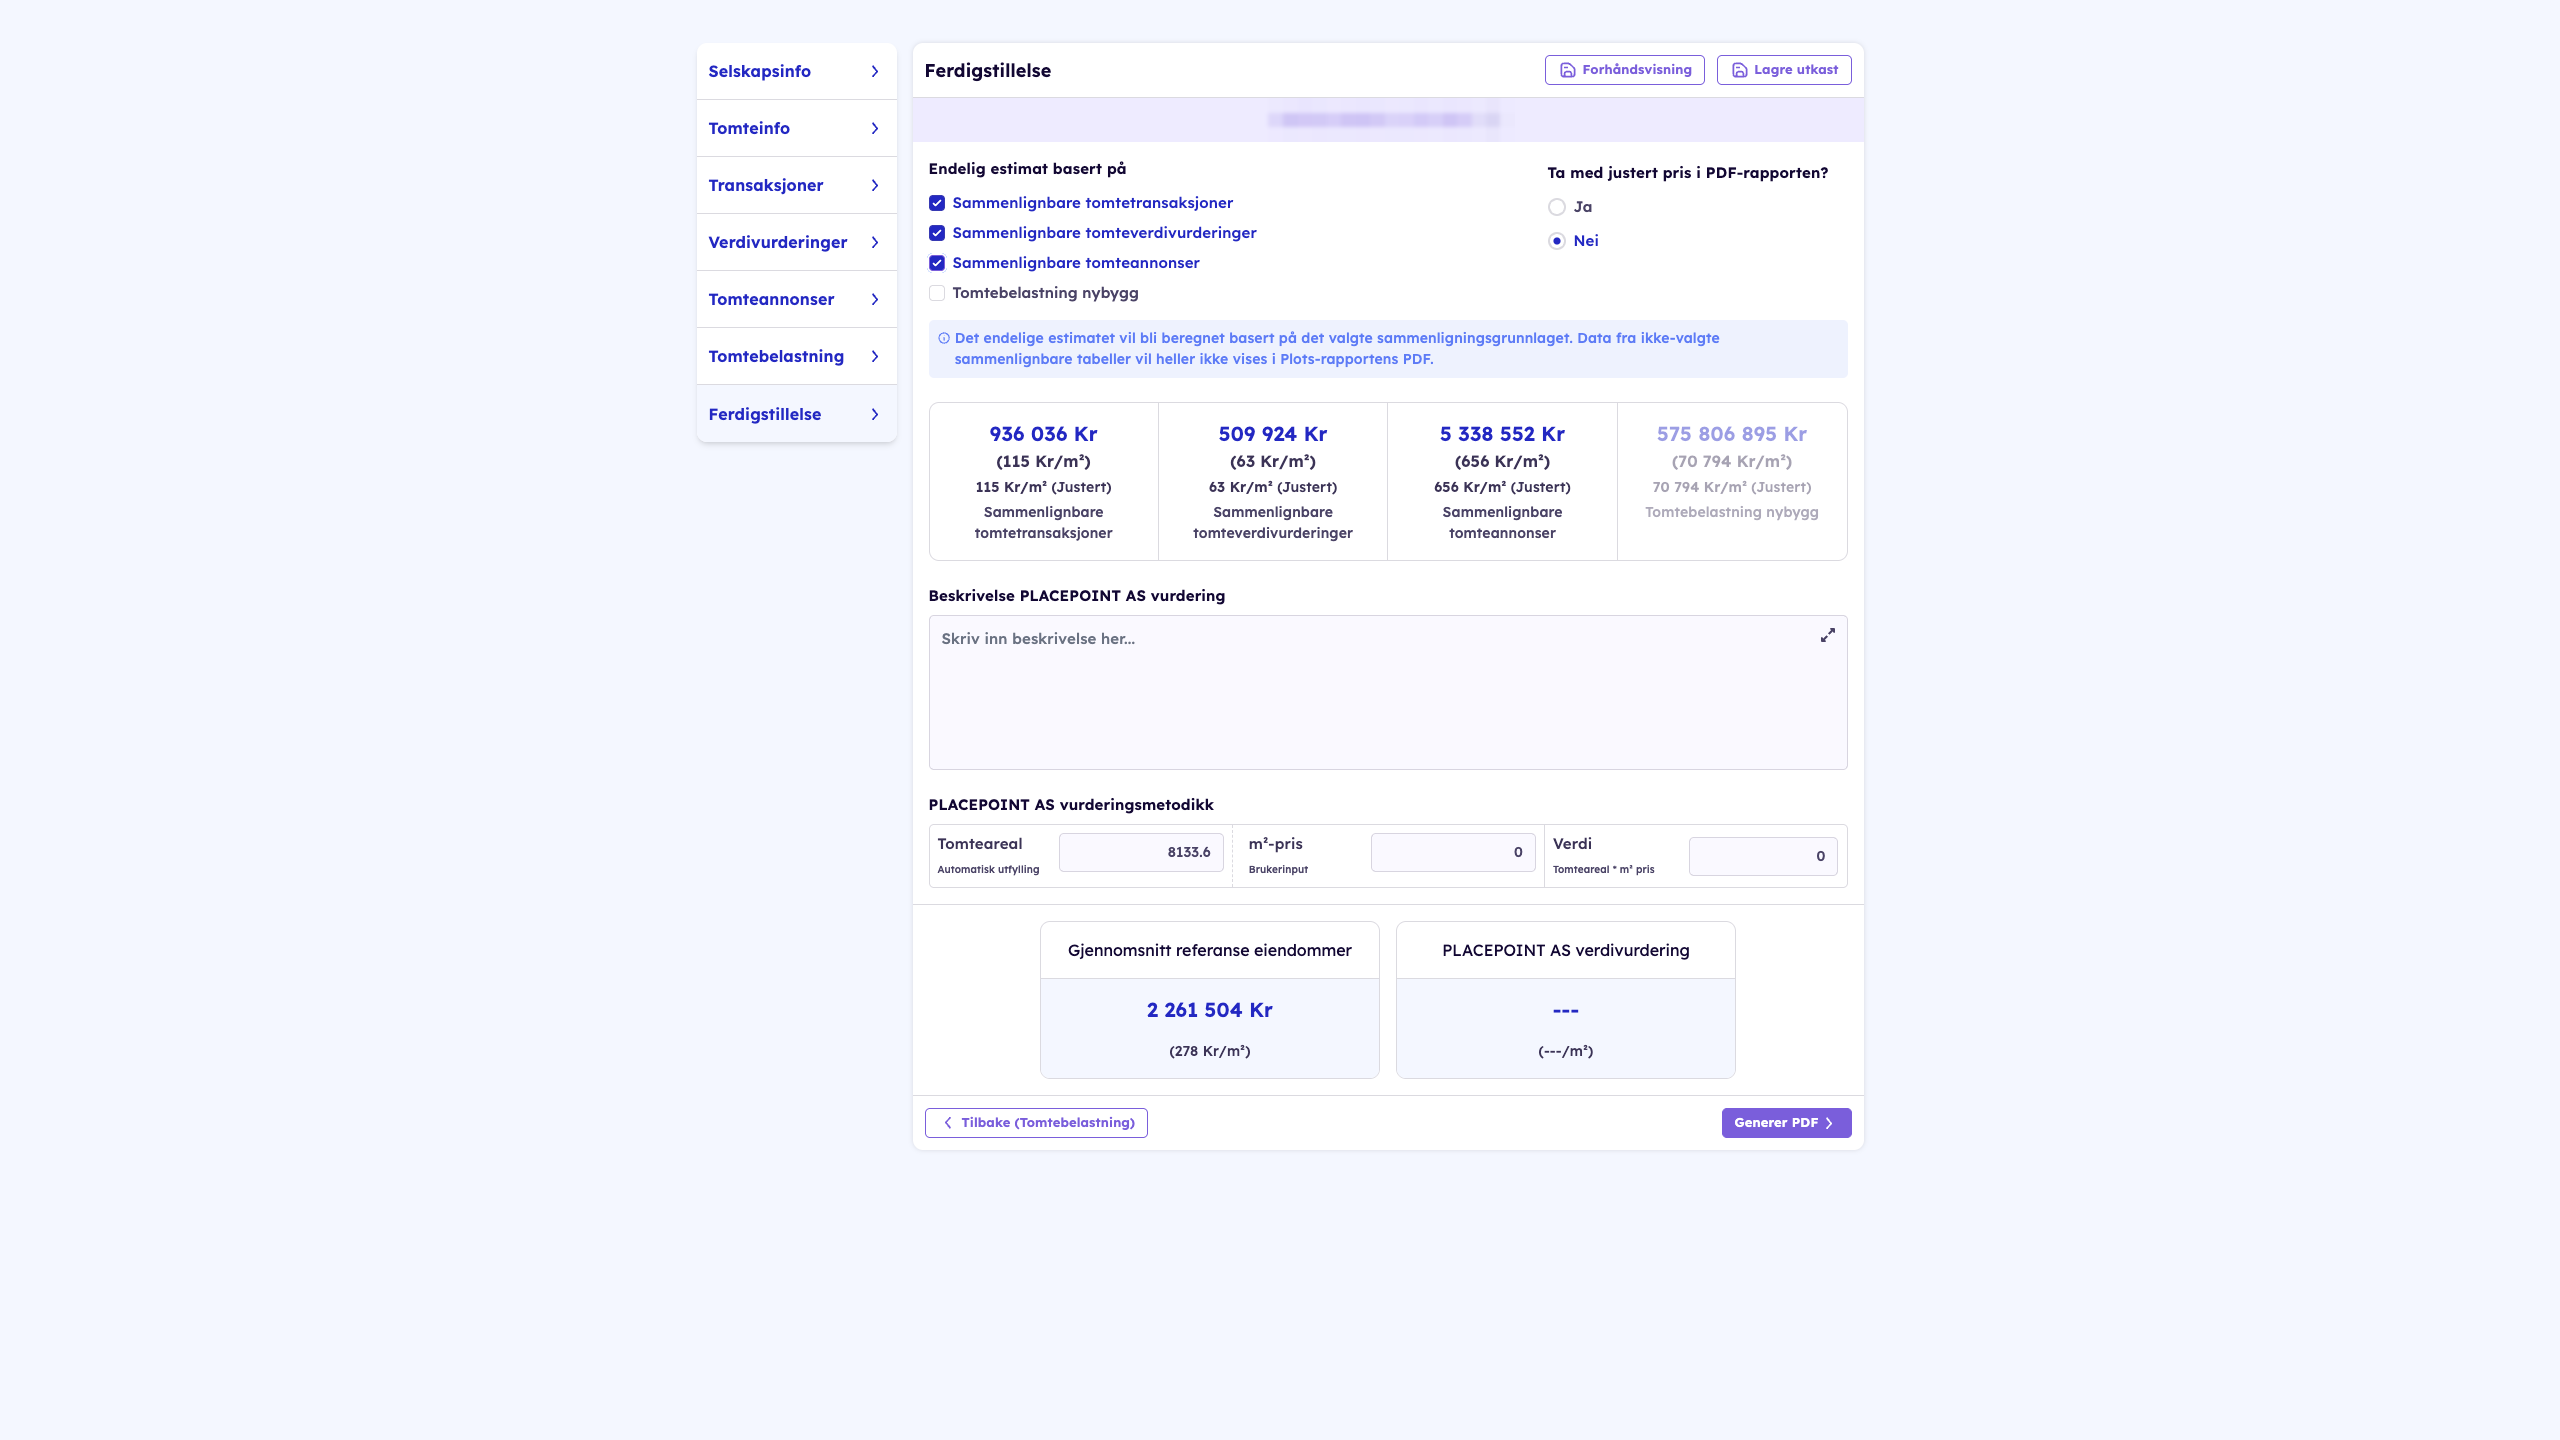
Completion. Tick which methods the final estimate should build on. The report calculates the average of them, and alongside it you set the company's own value as price per m² multiplied by the plot area, with a description of the assessment. Choose whether the adjusted price goes into the PDF, and click Generer PDF.


The PDF opens with the cover image, the address and the value on the front page. Then follows the presentation of the company and the plot information with title holders and sources. After that comes the satellite image and one section per method with the comparable sales. The chart shows price per m² as registered, market-adjusted and adjusted, and the last page sums up the value.
The report carries the company's profile
Each report uses the company's own logo, a presentation of the company, a cover image and a default image for the property units. We add them when we activate Allverdi for the company, and they are used in all the reports the company creates. The logo and the presentation must be in place before the first report can be made, the two images can be sent later.
The data basis
The report states its sources. The plot sales are registered transactions from Kartverket, from the matrikkel and Grunnboken, checked against building case data so developed plots drop out. The plot valuations are the plot value in valuation reports published in connection with property sales. The new build projects and the Plot Ads come from the sales ads, the same sources as New Build Project and Plot Ads under Analyze. The indices are the house price index for the area and the consumer price index from SSB. If the company has its own sales and valuations, we add them as a separate map layer when the company is activated.
The basis is densest for residential plots, where both the most plots are sold and the most projects are built. For commercial plots and plots in LNFR areas there are fewer comparable sales, and then the plot cost share and the valuation assessments carry more weight.
Allverdi in Placepoint Fusion
Coming soon!
In Placepoint Fusion you get the plot valuation as a separate tab in the property panel, on the property you are already on. Today you create the report in Allverdi as a separate tool.
See also
- Plot Valuation under Analyze: what plots in an area have sold for per m².
- The property panel: everything we know about one property, where the plot valuation gets its tab.
- Tomt, markedsverdi, tomtebelastning, festetomt and verdivurdering in the glossary.